Key takeaways
- A chart of accounts is the complete list of categories your accounting software uses to sort every financial transaction.
- Every chart of accounts is built from the same five types: assets, liabilities, equity, revenue, and expenses.
- Number accounts in standard blocks and leave gaps, such as 1010 and 1020, so new accounts fit in later.
- Most small businesses run well on 30 to 60 accounts, with more for inventory, job costing, or multiple revenue streams.
- Keep meals, advertising, and client gifts in separate accounts, because each is treated differently on a tax return.
In this article
- What Is a Chart of Accounts?
- The Five Account Types
- How to Number Your Chart of Accounts
- A Sample Chart of Accounts
- How Many Accounts Do You Actually Need?
- Setting It Up in QuickBooks Online or Xero
- Industry-Specific Adjustments
- Five Mistakes That Make a Chart of Accounts Useless
- How Your Chart of Accounts Affects Your Tax Bill
- Conclusion
- Frequently asked questions
Most messy books are not a data-entry problem. They are a structure problem.
When your accounting software hands you a default list of categories and you start using it without editing, every transaction gets filed into a container that was never designed for your business. Six months later the reports do not tell you anything useful, and your CPA is billing hours to untangle a Marketing account that contains ads, client lunches, and holiday gifts.
This guide covers what a chart of accounts is, how to set one up for a small business, how to number it, what a real example looks like, and the mistakes that cost the most at tax time.
What Is a Chart of Accounts?
#A chart of accounts is the complete list of categories your accounting software uses to sort every financial transaction. Each category is called an account, and each one usually carries a number. Every dollar entering or leaving your business gets filed into one of them.
Think of it as the filing system behind your financial statements. Your profit and loss statement and balance sheet are simply your chart of accounts, totaled up and arranged. That is why structure matters so much. If the filing system is wrong, every report built on it is wrong too.
The Five Account Types
#Every chart of accounts, in every business and every country, is built from the same five types.
| Type | What it holds | Common examples | Appears on |
|---|---|---|---|
| Assets | What your business owns | Checking account, accounts receivable, equipment, inventory | Balance sheet |
| Liabilities | What your business owes | Credit cards, accounts payable, loans, payroll taxes payable | Balance sheet |
| Equity | The owner's stake | Owner contributions, owner draws, retained earnings | Balance sheet |
| Revenue | What you earn | Product sales, service income, shipping income | Profit and loss |
| Expenses | What you spend | Rent, payroll, software, advertising, insurance | Profit and loss |
Two of those five deserve a note. Equity confuses most owners, but for a small business it usually comes down to three things: money you put in, money you take out, and profit left in the business. And expenses are where nearly every structural mistake happens, because that is the only category people keep adding to.
How to Number Your Chart of Accounts
#Account numbers are optional in most software. Use them anyway. They keep reports in a logical order instead of alphabetical, and they make it obvious where a new account belongs.
Chart of accounts numbering follows a widely used convention, and there is no reason to invent your own. The standard chart of accounts assigns each account type its own block of numbers:
| Number range | Account type |
|---|---|
| 1000 to 1999 | Assets |
| 2000 to 2999 | Liabilities |
| 3000 to 3999 | Equity |
| 4000 to 4999 | Revenue |
| 5000 to 5999 | Cost of goods sold |
| 6000 to 6999 | Operating expenses |
| 7000 to 8999 | Other income and other expenses |
Smaller businesses that do not track cost of goods sold often compress this, running expenses in the 5000s and skipping the 6000s entirely. Either approach works. What matters is that you pick one and stay consistent.
One rule saves the most future pain: leave gaps. Number your accounts 1010, 1020, 1030 rather than 1001, 1002, 1003. When you need to add an account between two existing ones, the gap is already there. Without it, you are renumbering the whole block or accepting an account that sits in the wrong place in every report from then on.
A Sample Chart of Accounts
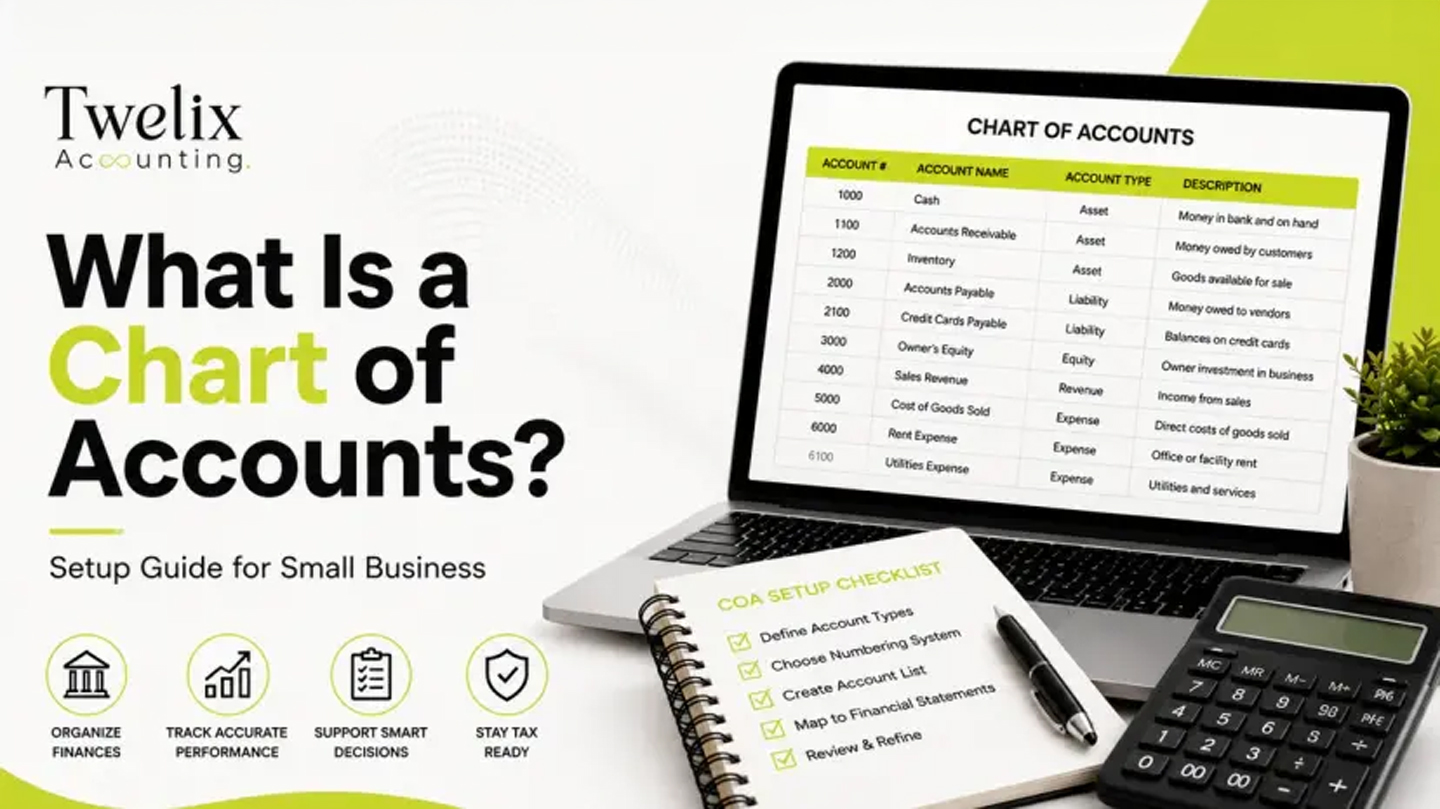
#Here is a chart of accounts example for a small service business. It is deliberately short, because a short chart of accounts that gets used correctly beats a long one that does not.
| Number | Account name | Type |
|---|---|---|
| 1010 | Business checking | Asset |
| 1020 | Business savings | Asset |
| 1200 | Accounts receivable | Asset |
| 1500 | Equipment | Asset |
| 1510 | Accumulated depreciation | Asset |
| 2010 | Accounts payable | Liability |
| 2020 | Business credit card | Liability |
| 2100 | Payroll liabilities | Liability |
| 2200 | Sales tax payable | Liability |
| 3010 | Owner contributions | Equity |
| 3020 | Owner draws | Equity |
| 3900 | Retained earnings | Equity |
| 4010 | Service income | Revenue |
| 4020 | Consulting income | Revenue |
| 4900 | Refunds and discounts | Revenue |
| 6010 | Payroll and wages | Expense |
| 6020 | Contractor payments | Expense |
| 6100 | Rent | Expense |
| 6110 | Utilities | Expense |
| 6200 | Software and subscriptions | Expense |
| 6300 | Advertising | Expense |
| 6310 | Meals (50% deductible) | Expense |
| 6320 | Client gifts | Expense |
| 6400 | Insurance | Expense |
| 6500 | Professional fees | Expense |
| 6600 | Bank and merchant fees | Expense |
Notice that meals, advertising, and client gifts sit in three separate accounts. That is not tidiness for its own sake. Those three are treated differently on a tax return, and separating them at the point of entry is the whole reason the structure exists.
 View full size
How Many Accounts Do You Actually Need?
#Published advice on this varies wildly. Some guides recommend 20 accounts, others 30 to 40, others 60 to 90. They cannot all be right, and none of them know your business.
Here is the more useful answer. Most small businesses run well on somewhere between 30 and 60 accounts. Three things push you toward the higher end: multiple revenue streams you need to compare, inventory or job costing, and expense categories with different tax treatment.
A simple test for any new account: will it hold more than a handful of transactions per quarter, and would you ever make a decision differently because you could see it separately? If the answer to both is no, fold it into the closest existing account. Every account you add is another option in the categorization dropdown, and another chance for something to land in the wrong place.
Setting It Up in QuickBooks Online or Xero
#Both platforms build you a starting chart of accounts automatically. In QuickBooks Online, the accounts you get depend on the business entity type you select during setup and on which features you switch on, so the exact list varies from one company file to another. Xero behaves similarly. Either way, treat what the software gives you as a draft, not a finished structure.
If you already have a chart of accounts template from your accountant, both platforms let you import it from a spreadsheet, which is faster than building accounts one at a time. Otherwise the setup sequence is the same on both:
- Turn on account numbers. In QuickBooks Online this is in Account and Settings under Advanced. It is off by default, which is why so many files never use it.
- Review every default account. Deactivate the ones your business will never use. Unused accounts are not harmless, because each one is another wrong option in the dropdown.
- Rename accounts to match your language. If your team says Subcontractors, do not leave the account called Cost of Labor.
- Add what is missing, using the numbering gaps.
- Write down what belongs in each account. One line each is enough. This single step prevents most misclassification, especially if anyone else ever touches the file.
One caution on merging and deleting. Some default accounts cannot be removed, only made inactive, and merging two accounts is not reversible. If a file already has a year of history in it, changing structure is a cleanup project rather than a settings change. We handle that work as QuickBooks bookkeeping and Xero bookkeeping engagements, and it is worth doing carefully rather than quickly.
Industry-Specific Adjustments
#The five types never change. What changes is the detail you need underneath revenue and direct costs.
Construction and trades. You need job-level cost tracking, which usually means separating materials, labor, subcontractors, and equipment under cost of goods sold, plus accounts for work in progress and retainage. Generic expense buckets make job profitability impossible to see. More on construction bookkeeping.
E-commerce. Split revenue by sales channel, and keep merchant fees, shipping income, shipping costs, and cost of goods sold in separate accounts. Platform payouts arrive net, so without this structure your revenue is understated. More on e-commerce bookkeeping.
Restaurants. Food cost and labor cost need to be visible separately and as a percentage of sales, because those two numbers are how the business is actually managed. Splitting food, beverage, and paper goods is normal. More on restaurant bookkeeping.
Professional services. Usually the simplest case. Separate revenue by service line if you price them differently, and keep reimbursable client costs out of your own expense accounts.
Five Mistakes That Make a Chart of Accounts Useless
#- Too many sub-accounts. A separate account for every vendor or every software subscription. It feels organized and produces a report nobody can read.
- Accepting the defaults unchanged. The software does not know your business. Default accounts you never use still appear in every dropdown.
- Mixing personal and business. Personal spending run through business accounts, or an owner draw recorded as an expense. The second one overstates costs and understates profit.
- One catch-all expense account. Miscellaneous, Other, or a Marketing account holding four unrelated things. Anything large sitting in a catch-all is a question at tax time.
- Never reviewing it. A structure built for a two-person business does not fit a fifteen-person one. Once a year, merge what is redundant, deactivate what is dead, and add what you now need.
How Your Chart of Accounts Affects Your Tax Bill
#This is the part most guides skip, and it is where structure stops being an accounting question and becomes a money question.
Three things happen to a business whose expense accounts do not line up with the lines on its tax return.
You pay for the same work twice. Your bookkeeper files a transaction into a general account. Your preparer opens it again in March to work out where it actually belonged. You are billed for both. On a pooled set of books, reclassification alone can add hours to a return that should have been straightforward.
You leave deductions on the table. When costs with different treatment sit in one account, a preparer working to a deadline takes the safest position available to them. Business meals are generally 50% deductible. Entertainment has not been deductible since the 2017 tax law changes. Business gifts are capped at $25 per recipient per year. Pooled into a single Marketing account, the deductible share becomes an estimate, and estimates made under time pressure tend to round against you.
You cannot see your tax position while you can still change it. If your profit and loss statement does not reflect real deductible cost, your quarterly estimates are guesses and your year-end planning options have expired by the time anyone spots the problem. That is the expensive one, because it is the only cost on this list you cannot fix retroactively.
Separating those accounts during setup takes a few minutes. Separating them the following March takes hours, and by then the planning year is closed. If your books already have everything pooled together, our cleanup service restructures the accounts and reclassifies the history, which is normally the first thing we do before tax preparation.
Deductibility rules described here are general and current as of August 2026. Confirm treatment for your own situation with your tax preparer.
 View full size
Conclusion
#A chart of accounts looks like an accounting formality. In practice it decides how much you pay at tax time, how many deductions you actually claim, and whether your monthly reports tell you anything you can act on.
The setup itself is not complicated. Keep it short enough to use correctly, number it with gaps, separate the costs your tax return treats differently, and review it once a year.
The harder part is keeping it that way once transactions start flowing, because a clean structure only stays clean if someone maintains it. That is what our outsourced bookkeeping service does. We build the chart of accounts around your industry and your reporting needs, then keep every transaction filed correctly, so your reports hold up during the year and your return holds up at the end of it.
Frequently asked questions
What is a chart of accounts?
A chart of accounts is the complete list of categories your accounting software uses to sort every transaction. Each category is an account, usually with a number, and all of them fall into five types: assets, liabilities, equity, revenue, and expenses. Your financial statements are built directly from it.
What is the difference between a chart of accounts and a general ledger?
The chart of accounts is the list of categories. The general ledger is the record of actual transactions filed into those categories. One is the empty filing system, the other is the filled drawers. You design the chart of accounts once and the ledger fills up continuously.
How many accounts should a small business have?
Most run well on 30 to 60. Push higher if you have multiple revenue streams to compare, inventory or job costing, or expense categories taxed differently. Before adding an account, ask whether you would ever make a different business decision for being able to see it on its own. If not, fold it into the nearest existing account.
How should I number my chart of accounts?
Use the standard blocks: 1000s for assets, 2000s liabilities, 3000s equity, 4000s revenue, 5000s cost of goods sold, 6000s operating expenses. Leave gaps between numbers, so 1010 and 1020 rather than 1001 and 1002, which lets you insert accounts later without renumbering.
Can I change my chart of accounts after I have started using it?
Yes, but carefully. Renaming is safe. Deactivating unused accounts is safe. Merging accounts is not reversible and will rewrite how past transactions appear in reports. If the file has a year or more of history, treat restructuring as a cleanup project rather than a quick edit.
Does QuickBooks give me a chart of accounts automatically?
Yes. QuickBooks Online creates a starting set based on the business entity you select and the features you enable, so the exact list differs between company files. Treat it as a draft. Deactivate what you will not use, rename what does not match your language, and add what is missing.
Should my chart of accounts match my tax return?
As closely as practical, yes. When expense accounts map to the lines on your return, tax prep becomes a reading exercise rather than a reclassification project, which means lower preparation fees and fewer deductions missed. This matters most for costs taxed differently, such as meals, entertainment, and client gifts.

CA Jaimin M.
Founder & CEO, Twelix Accounting
Published · Updated
Jaimin M. is the founder and CEO of Twelix Accounting, where he leads strategy and overall direction. A Chartered Accountant with more than eight years in U.S. accounting, he shapes how Twelix delivers outsourced bookkeeping and accounting services to small businesses. When he is not running the company, he is deep in a game, insisting it is helping his strategy skills.
Connect on LinkedIn